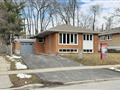
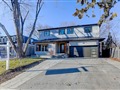
108 Lynedock Cres
$1,571,241
Comparative Market Analysis
May 12, 2024
NOT AN ACTIVE LISTING
Historical Performance
| Period | $ Change | % Change |
| 1 Day | +$327 | +0.021% |
| 7 Days | -$228 | -0.015% |
| 30 Days | -$4,163 | -0.264% |
| 3 Months | -$7,173 | -0.454% |
| 6 Months | +$22.3k | +1.44% |
| 1 Year | -$83.8k | -5.06% |
| 3 Years | +$179k | +12.9% |
| 5 Years | +$314k | +25.0% |
| 10 Years | +$796k | +103% |
List My Property
Real Estate Statistics
Financing Solutions
AS SEEN ON


Are You a Licensed Real Estate Agent or Broker?