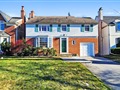
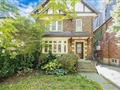
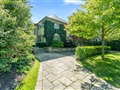
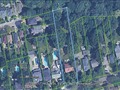
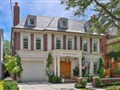
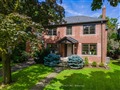
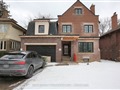
93 Burnaby Blvd
$1,948,673
Comparative Market Analysis
Jul 6, 2025
NOT AN ACTIVE LISTING
Historical Performance
| Period | $ Change | % Change |
| 1 Day | +$329 | +0.017% |
| 7 Days | -$368 | -0.019% |
| 30 Days | -$4,835 | -0.247% |
| 3 Months | -$6,579 | -0.336% |
| 6 Months | +$33.5k | +1.75% |
| 1 Year | -$92.6k | -4.54% |
| 3 Years | +$188k | +10.7% |
| 5 Years | +$411k | +26.8% |
| 10 Years | +$1.09m | +126% |
List My Property
Real Estate Statistics
Financing Solutions
Browsing History
98 Ava Rd, Toronto
1 second ago
130 Burnaby Blvd, Toronto
2 seconds ago
10 Tumbleweed Rd, Toronto
3 seconds ago
25 Soho St P107, Toronto
4 seconds ago
15 Beaver Valley Rd, Toronto
5 seconds ago
55 Lamay Cres, Toronto
6 seconds ago
48 Millhouse Cres, Toronto
7 seconds ago
216 Ava Rd, Toronto
8 seconds ago
90 West Lynn Ave, Toronto
9 seconds ago
28 Marathon Cres, Toronto
10 seconds ago
AS SEEN ON


Are You a Licensed Real Estate Agent or Broker?