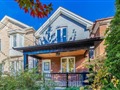
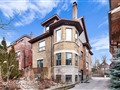
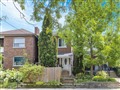
73 Ashburnham Rd
$1,378,695
Comparative Market Analysis
Jul 7, 2025
NOT AN ACTIVE LISTING
Historical Performance
| Period | $ Change | % Change |
| 1 Day | +$335 | +0.024% |
| 7 Days | +$117 | +0.008% |
| 30 Days | -$2,549 | -0.185% |
| 3 Months | -$3,398 | -0.246% |
| 6 Months | +$25.1k | +1.86% |
| 1 Year | -$58.4k | -4.06% |
| 3 Years | +$109k | +8.55% |
| 5 Years | +$289k | +26.5% |
| 10 Years | +$680k | +97.4% |
List My Property
Real Estate Statistics
Financing Solutions
Browsing History
62 Sandhurst Circ, Toronto
1 second ago
74 Wolseley St, Toronto
2 seconds ago
350 Annette St, Toronto
2 seconds ago
300 Mill Rd C40, Toronto
2 seconds ago
154 Heward Ave, Toronto
2 seconds ago
AS SEEN ON


Are You a Licensed Real Estate Agent or Broker?