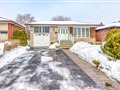
65 Sun Row Dr
$1,680,728
Comparative Market Analysis
Jun 30, 2025
NOT AN ACTIVE LISTING
Historical Performance
| Period | $ Change | % Change |
| 1 Day | +$373 | +0.022% |
| 7 Days | -$68 | -0.004% |
| 30 Days | -$3,808 | -0.226% |
| 3 Months | -$5,952 | -0.353% |
| 6 Months | +$27.0k | +1.64% |
| 1 Year | -$81.6k | -4.63% |
| 3 Years | +$253k | +17.7% |
| 5 Years | +$510k | +43.6% |
| 10 Years | +$919k | +121% |
List My Property
Real Estate Statistics
Financing Solutions
Browsing History
16 Vanevery St, Toronto
1 second ago
AS SEEN ON


Are You a Licensed Real Estate Agent or Broker?