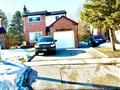
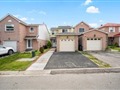
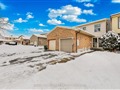
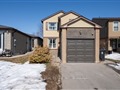
65 Gorsey Sq
$1,081,267
Comparative Market Analysis
Jun 6, 2025
NOT AN ACTIVE LISTING
Historical Performance
| Period | $ Change | % Change |
| 1 Day | +$280 | +0.026% |
| 7 Days | +$62 | +0.006% |
| 30 Days | -$2,309 | -0.213% |
| 3 Months | -$3,941 | -0.363% |
| 6 Months | +$16.8k | +1.58% |
| 1 Year | -$52.2k | -4.60% |
| 3 Years | +$163k | +17.8% |
| 5 Years | +$303k | +38.8% |
| 10 Years | +$620k | +134% |
List My Property
Real Estate Statistics
Financing Solutions
Browsing History
180 Lambton Ave, Toronto
1 second ago
516 St Clements Ave, Toronto
1 second ago
AS SEEN ON


Are You a Licensed Real Estate Agent or Broker?