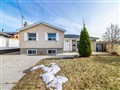
64 Tobermory Dr
$919,115
Comparative Market Analysis
Jul 10, 2025
NOT AN ACTIVE LISTING
Historical Performance
| Period | $ Change | % Change |
| 1 Day | +$239 | +0.026% |
| 7 Days | +$31 | +0.003% |
| 30 Days | -$2,093 | -0.227% |
| 3 Months | -$3,879 | -0.420% |
| 6 Months | +$13.0k | +1.43% |
| 1 Year | -$48.1k | -4.97% |
| 3 Years | +$144k | +18.6% |
| 5 Years | +$229k | +33.3% |
| 10 Years | +$501k | +120% |
List My Property
Real Estate Statistics
Financing Solutions
Browsing History
33 Charles St 3303, Toronto
1 second ago
42 Charles St 2409, Toronto
2 seconds ago
110 Charles St 2910, Toronto
2 seconds ago
212 Humberside Ave, Toronto
2 seconds ago
80 Charles St 805, Toronto
2 seconds ago
33 Charles St 3404, Toronto
3 seconds ago
AS SEEN ON


Are You a Licensed Real Estate Agent or Broker?