SALES HISTORY
MARKET STATS
PROPERTY DESCRIPTION
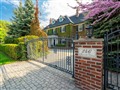
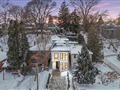
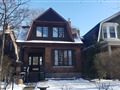
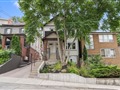
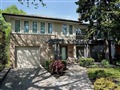
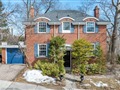
64 Indian Tr is a 6-bedroom 3-washroom detached house located in High Park-Swansea community of Toronto. It is currently NOT FOR SALE, but is
worth in our opinion around $3,875,549
.
The property is situated on a 48' frontage by 198' deep lot. 64 Indian Tr is currently not for sale and is not an active listing on Listing.ca.
NEARBY SCHOOLS
Humberside Montessori School
1.5 km
121 Kennedy Ave, M6S2X8
Phone: (416) 762-8888
La Petite Ecole
1.5 km
130 Kennedy Ave, M6S2X9
Phone: (416) 871-6145
NEARBY MEDICAL CENTRES
Runnymede Walk-in Medical Clinic
1.5 km
208-2213 Bloor St W, M6S1N5
Phone: (416) 800-9697
NEARBY GROCERY STORES
Cheese Boutique & Delicatessen
2.4 km
45 Ripley Ave, M6S3P2
Phone: (416) 762-6292
No Frills
1.3 km
2187 Bloor St W, M6S1N2
Phone: (416) 234-2068
NEARBY RESTAURANTS AND CAFETERIAS
Pizza Pizza
0.2 km
1721 Bloor St W, M6P1B2
Phone: (647) 345-5585
Pizza Pizza
1.4 km
2241 Bloor St W, M6S1N3
Phone: (647) 345-5585
Queen's Pasta Cafe
1.7 km
2263 Bloor St W, M6S1N8
Phone: (647) 345-5585
Subway
0.2 km
1717 Bloor St W, M6P1B2
Phone: (647) 345-5585
The Roncy Public Grill & Lounge
0.6 km
390 Roncesvalles Ave, M6R2M9
Phone: (416) 604-9322
NEARBY COFFEE SHOPS
Queen's Pasta Cafe
1.7 km
2263 Bloor St W, M6S1N8
Phone: (416) 203-6100
Tim Hortons
0.1 km
1728 Bloor Street West, M6P1A8
Phone: (416) 767-2788
NEARBY BANKS
CIBC
1.5 km
2219 Bloor St W, M6S1N5
Phone: (416) 763-5124
TD Canada Trust
0.6 km
382 Roncesvalles Ave, M6R2M9
Phone: (416) 536-2300
NEARBY HEALTH AND FITNESS FACILITIES
Emchi Shakya Dorje Ltd
2.0 km
204 Windermere Ave, M6S3J7
Phone: (416) 762-2886
NEARBY LIQUOR STORES
LCBO
1.4 km
2180 Bloor St W, M6S1N3
Phone: (416) 767-8931
Liquor Control Board Of Ontario
1.4 km
2180 Bloor St W, M6S1N3
Phone: (416) 767-8931