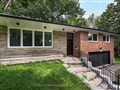
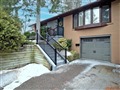
63 Milldock Dr
$1,195,437
Comparative Market Analysis
Jun 12, 2025
NOT AN ACTIVE LISTING
Historical Performance
| Period | $ Change | % Change |
| 1 Day | +$279 | +0.023% |
| 7 Days | +$79 | +0.007% |
| 30 Days | -$2,224 | -0.186% |
| 3 Months | -$2,902 | -0.242% |
| 6 Months | +$21.8k | +1.85% |
| 1 Year | -$51.9k | -4.16% |
| 3 Years | +$195k | +19.5% |
| 5 Years | +$341k | +39.9% |
| 10 Years | +$695k | +139% |
List My Property
Real Estate Statistics
Financing Solutions
Browsing History
26 Dover Dr, Toronto
6 seconds ago
43 Robindale Ave, Toronto
11 seconds ago
7 Tollerton Ave, Toronto
16 seconds ago
42 Minnacote Ave, Toronto
21 seconds ago
20 Galloway Rd, Toronto
26 seconds ago
AS SEEN ON


Are You a Licensed Real Estate Agent or Broker?