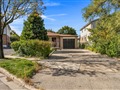
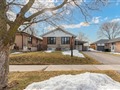
63 Cinrickbar Dr
$1,185,772
Comparative Market Analysis
Jun 6, 2025
NOT AN ACTIVE LISTING
Historical Performance
| Period | $ Change | % Change |
| 1 Day | +$300 | +0.025% |
| 7 Days | +$289 | +0.024% |
| 30 Days | -$1,371 | -0.115% |
| 3 Months | -$355 | -0.030% |
| 6 Months | +$27.0k | +2.33% |
| 1 Year | -$36.1k | -2.95% |
| 3 Years | +$244k | +26.0% |
| 5 Years | +$398k | +50.6% |
| 10 Years | +$717k | +153% |
List My Property
Real Estate Statistics
Financing Solutions
Browsing History
1055 Bay St 211, Toronto
1 second ago
832 Bay St 3608, Toronto
2 seconds ago
140 Cinrickbar Dr, Toronto
2 seconds ago
Pembroke St, Toronto
2 seconds ago
1166 Bay St 1701, Toronto
2 seconds ago
1166 Bay St 903, Toronto
3 seconds ago
8 Tartan Ave, Toronto
3 seconds ago
Thirty-Seventh St, Toronto
3 seconds ago
784 Adelaide St LowerFl, Toronto
3 seconds ago
AS SEEN ON


Are You a Licensed Real Estate Agent or Broker?