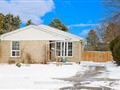
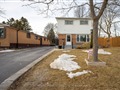
61 Sunburst Sq
$1,009,318
Comparative Market Analysis
Jun 7, 2025
NOT AN ACTIVE LISTING
Historical Performance
| Period | $ Change | % Change |
| 1 Day | +$261 | +0.026% |
| 7 Days | +$92 | +0.009% |
| 30 Days | -$2,000 | -0.198% |
| 3 Months | -$3,272 | -0.323% |
| 6 Months | +$16.3k | +1.64% |
| 1 Year | -$48.2k | -4.56% |
| 3 Years | +$161k | +19.0% |
| 5 Years | +$302k | +42.7% |
| 10 Years | +$609k | +152% |
List My Property
Real Estate Statistics
Financing Solutions
Browsing History
51 Abbeville Rd, Toronto
1 second ago
20 Riverdale Ave, Toronto
2 seconds ago
58 Amoro Dr, Toronto
3 seconds ago
105 Mccartney St TH1, Toronto
4 seconds ago
8 Queen Victoria St, Toronto
5 seconds ago
9 Abbeville Rd, Toronto
6 seconds ago
105 Mccartney St 205, Toronto
7 seconds ago
105 Mccartney St 405, Toronto
8 seconds ago
19 Queen Victoria St, Toronto
9 seconds ago
47 Sunburst Sq, Toronto
10 seconds ago
AS SEEN ON


Are You a Licensed Real Estate Agent or Broker?