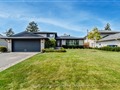
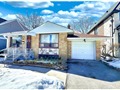
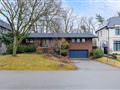
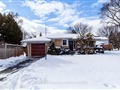
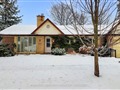
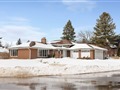
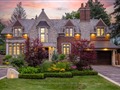
61 Bywood Dr
$2,602,425
Comparative Market Analysis
Jun 29, 2025
NOT AN ACTIVE LISTING
Historical Performance
| Period | $ Change | % Change |
| 1 Day | +$512 | +0.020% |
| 7 Days | -$58 | -0.002% |
| 30 Days | -$5,039 | -0.193% |
| 3 Months | -$5,395 | -0.207% |
| 6 Months | +$50.6k | +1.98% |
| 1 Year | -$108k | -3.99% |
| 3 Years | +$353k | +15.7% |
| 5 Years | +$673k | +34.9% |
| 10 Years | +$1.57m | +152% |
List My Property
Real Estate Statistics
Financing Solutions
Browsing History
570 Ridelle Ave, Toronto
1 second ago
2 Graywood Dr, Toronto
1 second ago
AS SEEN ON

Are You a Licensed Real Estate Agent or Broker?