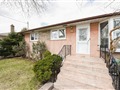
60 Fenley Dr
$1,170,839
Comparative Market Analysis
Jun 23, 2025
NOT AN ACTIVE LISTING
Historical Performance
| Period | $ Change | % Change |
| 1 Day | +$241 | +0.021% |
| 7 Days | -$181 | -0.015% |
| 30 Days | -$3,123 | -0.266% |
| 3 Months | -$5,360 | -0.456% |
| 6 Months | +$16.6k | +1.44% |
| 1 Year | -$62.5k | -5.07% |
| 3 Years | +$296k | +33.8% |
| 5 Years | +$399k | +51.6% |
| 10 Years | +$643k | +122% |
List My Property
Real Estate Statistics
Financing Solutions
AS SEEN ON


Are You a Licensed Real Estate Agent or Broker?