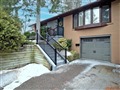
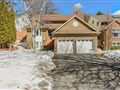
59 Milldock Dr
$1,074,277
Comparative Market Analysis
Jun 12, 2025
NOT AN ACTIVE LISTING
Historical Performance
| Period | $ Change | % Change |
| 1 Day | +$251 | +0.023% |
| 7 Days | +$30 | +0.003% |
| 30 Days | -$2,201 | -0.204% |
| 3 Months | -$3,261 | -0.303% |
| 6 Months | +$18.2k | +1.72% |
| 1 Year | -$49.7k | -4.43% |
| 3 Years | +$165k | +18.1% |
| 5 Years | +$288k | +36.7% |
| 10 Years | +$598k | +125% |
List My Property
Real Estate Statistics
Financing Solutions
Browsing History
78 Warren Rd 105, Toronto
1 second ago
24 Moorefield Dr, Toronto
1 second ago
15 Broadfield Dr, Toronto
2 seconds ago
37 Milldock Dr, Toronto
2 seconds ago
15 Minnacote Ave, Toronto
2 seconds ago
63 Eunice Rd, Toronto
3 seconds ago
AS SEEN ON


Are You a Licensed Real Estate Agent or Broker?