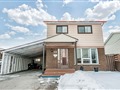
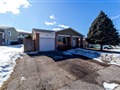
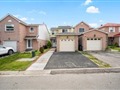
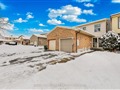
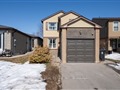
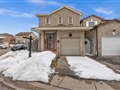
59 Crow Tr
$1,001,823
Comparative Market Analysis
Jun 26, 2025
NOT AN ACTIVE LISTING
Historical Performance
| Period | $ Change | % Change |
| 1 Day | +$259 | +0.026% |
| 7 Days | +$21 | +0.002% |
| 30 Days | -$2,325 | -0.232% |
| 3 Months | -$4,345 | -0.432% |
| 6 Months | +$13.9k | +1.41% |
| 1 Year | -$50.9k | -4.83% |
| 3 Years | +$160k | +19.1% |
| 5 Years | +$305k | +43.7% |
| 10 Years | +$621k | +163% |
List My Property
Real Estate Statistics
Financing Solutions
Browsing History
18 Hatchet Pl, Toronto
1 second ago
AS SEEN ON


Are You a Licensed Real Estate Agent or Broker?