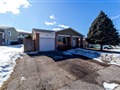
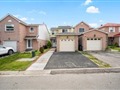
56 Wickson Tr
$1,398,652
Comparative Market Analysis
Jun 29, 2025
NOT AN ACTIVE LISTING
Historical Performance
| Period | $ Change | % Change |
| 1 Day | +$362 | +0.026% |
| 7 Days | +$434 | +0.031% |
| 30 Days | -$1,263 | -0.090% |
| 3 Months | +$384 | +0.027% |
| 6 Months | +$32.8k | +2.40% |
| 1 Year | -$42.8k | -2.97% |
| 3 Years | +$304k | +27.8% |
| 5 Years | +$559k | +66.6% |
| 10 Years | +$1.00m | +252% |
List My Property
Real Estate Statistics
Financing Solutions
AS SEEN ON


Are You a Licensed Real Estate Agent or Broker?