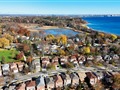
56 Milldock Dr
$1,355,674
Comparative Market Analysis
Jun 12, 2025
NOT AN ACTIVE LISTING
Historical Performance
| Period | $ Change | % Change |
| 1 Day | +$317 | +0.023% |
| 7 Days | -$53 | -0.004% |
| 30 Days | -$3,223 | -0.237% |
| 3 Months | -$5,572 | -0.409% |
| 6 Months | +$19.9k | +1.49% |
| 1 Year | -$69.9k | -4.91% |
| 3 Years | +$183k | +15.6% |
| 5 Years | +$318k | +30.6% |
| 10 Years | +$701k | +107% |
List My Property
Real Estate Statistics
Financing Solutions
AS SEEN ON


Are You a Licensed Real Estate Agent or Broker?