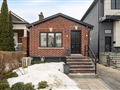
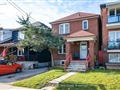
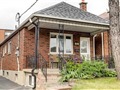
53 Montcalm Ave
$1,141,886
Comparative Market Analysis
Jun 30, 2025
NOT AN ACTIVE LISTING
Historical Performance
| Period | $ Change | % Change |
| 1 Day | +$275 | +0.024% |
| 7 Days | +$91 | +0.008% |
| 30 Days | -$2,129 | -0.186% |
| 3 Months | -$2,948 | -0.258% |
| 6 Months | +$20.2k | +1.80% |
| 1 Year | -$51.0k | -4.28% |
| 3 Years | +$145k | +14.5% |
| 5 Years | +$295k | +34.9% |
| 10 Years | +$673k | +143% |
List My Property
Real Estate Statistics
Financing Solutions
Browsing History
556 Marlee Ave, Toronto
5 seconds ago
145 Cornell Ave, Toronto
10 seconds ago
105 Auburn Ave, Toronto
15 seconds ago
63 Queensbury Ave, Toronto
20 seconds ago
140 Leyton Ave, Toronto
25 seconds ago
AS SEEN ON


Are You a Licensed Real Estate Agent or Broker?