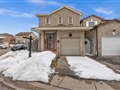
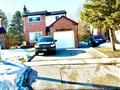
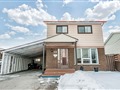
53 Mcknight Dr
$1,038,843
Comparative Market Analysis
Jun 8, 2025
NOT AN ACTIVE LISTING
Historical Performance
| Period | $ Change | % Change |
| 1 Day | +$269 | +0.026% |
| 7 Days | +$145 | +0.014% |
| 30 Days | -$1,809 | -0.174% |
| 3 Months | -$2,525 | -0.242% |
| 6 Months | +$18.6k | +1.82% |
| 1 Year | -$45.0k | -4.15% |
| 3 Years | +$184k | +21.5% |
| 5 Years | +$340k | +48.6% |
| 10 Years | +$630k | +154% |
List My Property
Real Estate Statistics
Financing Solutions
Browsing History
19 Barberry Pl 106, Toronto
1 second ago
89 Janray Dr, Toronto
1 second ago
262 St. Helens Ave 210, Toronto
1 second ago
87 Bristol Ave, Toronto
1 second ago
255 Maria St, Toronto
2 seconds ago
1091 Dovercourt Rd, Toronto
2 seconds ago
94 Futura Dr, Toronto
2 seconds ago
20 Burkebrook Pl 416, Toronto
2 seconds ago
68 Gormley Ave, Toronto
3 seconds ago
921 Midland Ave 602, Toronto
3 seconds ago
AS SEEN ON


Are You a Licensed Real Estate Agent or Broker?