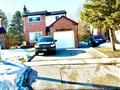
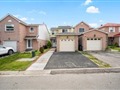
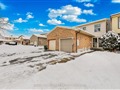
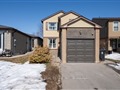
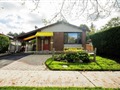
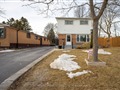
50 Howell Sq
$1,073,394
Comparative Market Analysis
Jun 26, 2025
NOT AN ACTIVE LISTING
Historical Performance
| Period | $ Change | % Change |
| 1 Day | +$278 | +0.026% |
| 7 Days | +$101 | +0.009% |
| 30 Days | -$2,111 | -0.196% |
| 3 Months | -$3,435 | -0.319% |
| 6 Months | +$17.4k | +1.65% |
| 1 Year | -$51.2k | -4.55% |
| 3 Years | +$170k | +18.9% |
| 5 Years | +$319k | +42.4% |
| 10 Years | +$649k | +153% |
List My Property
Real Estate Statistics
Financing Solutions
Browsing History
26 Whiteleas Ave, Toronto
5 seconds ago
Morley Crt, Toronto
10 seconds ago
51 Whiteleas Ave, Toronto
15 seconds ago
2 Nahanni Terr, Toronto
20 seconds ago
116 Glenforest Rd, Toronto
25 seconds ago
23 Day Ave, Toronto
30 seconds ago
Hartfield Rd, Toronto
35 seconds ago
8 Purvis Cres, Toronto
40 seconds ago
6 Whiteleas Ave, Toronto
45 seconds ago
48 Whiteleas Ave, Toronto
50 seconds ago
AS SEEN ON


Are You a Licensed Real Estate Agent or Broker?