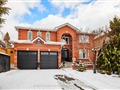
49 Feagan Dr
$1,563,530
Comparative Market Analysis
Jul 1, 2025
NOT AN ACTIVE LISTING
Historical Performance
| Period | $ Change | % Change |
| 1 Day | +$358 | +0.023% |
| 7 Days | +$133 | +0.009% |
| 30 Days | -$2,670 | -0.170% |
| 3 Months | -$2,756 | -0.176% |
| 6 Months | +$31.1k | +2.03% |
| 1 Year | -$60.2k | -3.71% |
| 3 Years | +$337k | +27.5% |
| 5 Years | +$563k | +56.2% |
| 10 Years | +$866k | +124% |
List My Property
Real Estate Statistics
Financing Solutions
Browsing History
8 Bellvare Cres, Toronto
6 seconds ago
19 Bellvare Cres, Toronto
11 seconds ago
43 Lowry Sq, Toronto
16 seconds ago
162 Fundy Bay Blvd, Toronto
19 seconds ago
AS SEEN ON


Are You a Licensed Real Estate Agent or Broker?