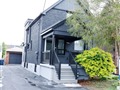
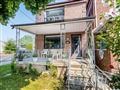
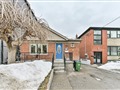
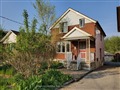
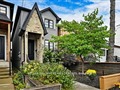
49 Dynevor Rd
$1,332,807
Comparative Market Analysis
Jun 13, 2025
NOT AN ACTIVE LISTING
Historical Performance
| Period | $ Change | % Change |
| 1 Day | +$327 | +0.025% |
| 7 Days | -$16 | -0.001% |
| 30 Days | -$3,138 | -0.235% |
| 3 Months | -$5,628 | -0.420% |
| 6 Months | +$19.1k | +1.45% |
| 1 Year | -$69.6k | -4.96% |
| 3 Years | +$169k | +14.6% |
| 5 Years | +$289k | +27.7% |
| 10 Years | +$719k | +117% |
List My Property
Real Estate Statistics
Financing Solutions
Browsing History
1029 Spadina Rd, Toronto
1 second ago
320 Horsham Ave, Toronto
2 seconds ago
287 Friendship Ave, Toronto
2 seconds ago
AS SEEN ON


Are You a Licensed Real Estate Agent or Broker?