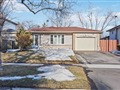
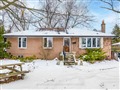
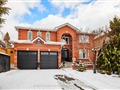
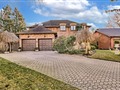
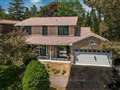
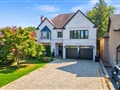
49 Bridgeport Dr
$1,352,810
Comparative Market Analysis
Jun 21, 2025
NOT AN ACTIVE LISTING
Historical Performance
| Period | $ Change | % Change |
| 1 Day | +$309 | +0.023% |
| 7 Days | -$79 | -0.006% |
| 30 Days | -$3,276 | -0.242% |
| 3 Months | -$5,639 | -0.415% |
| 6 Months | +$19.9k | +1.49% |
| 1 Year | -$69.9k | -4.92% |
| 3 Years | +$228k | +20.2% |
| 5 Years | +$401k | +42.1% |
| 10 Years | +$768k | +132% |
List My Property
Real Estate Statistics
Financing Solutions
Browsing History
121 Langley Ave, Toronto
0 second ago
256 Chaplin Cres, Toronto
1 second ago
230 Simcoe St 2017, Toronto
1 second ago
436 Harvie Ave, Toronto
1 second ago
208 Niagara St TH56, Toronto
2 seconds ago
AS SEEN ON


Are You a Licensed Real Estate Agent or Broker?