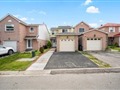
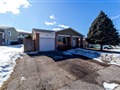
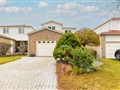
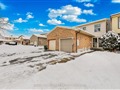
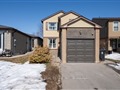
48 Mcknight Dr
$922,245
Comparative Market Analysis
Jun 6, 2025
NOT AN ACTIVE LISTING
Historical Performance
| Period | $ Change | % Change |
| 1 Day | +$239 | +0.026% |
| 7 Days | +$20 | +0.002% |
| 30 Days | -$2,141 | -0.232% |
| 3 Months | -$4,000 | -0.432% |
| 6 Months | +$12.8k | +1.41% |
| 1 Year | -$48.8k | -5.02% |
| 3 Years | +$132k | +16.7% |
| 5 Years | +$239k | +35.1% |
| 10 Years | +$556k | +152% |
List My Property
Real Estate Statistics
Financing Solutions
Browsing History
55 Houston Cres, Toronto
5 seconds ago
AS SEEN ON


Are You a Licensed Real Estate Agent or Broker?