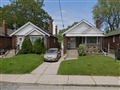
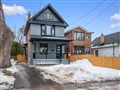
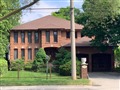
43 Delwood Dr
$1,165,613
Comparative Market Analysis
Jul 10, 2025
NOT AN ACTIVE LISTING
Historical Performance
| Period | $ Change | % Change |
| 1 Day | +$253 | +0.022% |
| 7 Days | -$53 | -0.005% |
| 30 Days | -$2,619 | -0.224% |
| 3 Months | -$3,967 | -0.339% |
| 6 Months | +$19.2k | +1.67% |
| 1 Year | -$55.8k | -4.57% |
| 3 Years | +$139k | +13.5% |
| 5 Years | +$292k | +33.5% |
| 10 Years | +$666k | +133% |
List My Property
Real Estate Statistics
Financing Solutions
Browsing History
124 Presley Ave, Toronto
1 second ago
35 Empress Ave PH104, Toronto
2 seconds ago
23 Eldora Ave 76, Toronto
2 seconds ago
AS SEEN ON


Are You a Licensed Real Estate Agent or Broker?