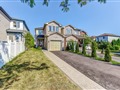
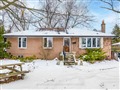
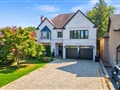
43 Bridgeport Dr
$1,306,031
Comparative Market Analysis
Jun 30, 2025
NOT AN ACTIVE LISTING
Historical Performance
| Period | $ Change | % Change |
| 1 Day | +$299 | +0.023% |
| 7 Days | -$101 | -0.008% |
| 30 Days | -$3,286 | -0.251% |
| 3 Months | -$5,842 | -0.445% |
| 6 Months | +$18.4k | +1.43% |
| 1 Year | -$69.4k | -5.04% |
| 3 Years | +$214k | +19.6% |
| 5 Years | +$377k | +40.6% |
| 10 Years | +$727k | +126% |
List My Property
Real Estate Statistics
Financing Solutions
Browsing History
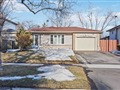
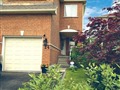
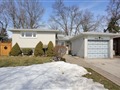
211 Victor Ave, Toronto
1 second ago
17 Deerhurst Ave, Toronto
2 seconds ago
12 Irvine Rd, Toronto
2 seconds ago
50 Baleberry Cres, Toronto
2 seconds ago
70 Marlow Ave, Toronto
2 seconds ago
50 Aldridge Ave, Toronto
3 seconds ago
AS SEEN ON


Are You a Licensed Real Estate Agent or Broker?