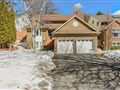
42 Milldock Dr
$1,296,406
Comparative Market Analysis
Jun 12, 2025
NOT AN ACTIVE LISTING
Historical Performance
| Period | $ Change | % Change |
| 1 Day | +$303 | +0.023% |
| 7 Days | -$15 | -0.001% |
| 30 Days | -$2,908 | -0.224% |
| 3 Months | -$4,770 | -0.367% |
| 6 Months | +$20.2k | +1.58% |
| 1 Year | -$64.4k | -4.73% |
| 3 Years | +$183k | +16.4% |
| 5 Years | +$317k | +32.4% |
| 10 Years | +$692k | +114% |
List My Property
Real Estate Statistics
Financing Solutions
AS SEEN ON


Are You a Licensed Real Estate Agent or Broker?