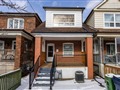
42 Mc Farland Ave
$1,156,951
Comparative Market Analysis
Jul 10, 2025
NOT AN ACTIVE LISTING
Historical Performance
| Period | $ Change | % Change |
| 1 Day | +$281 | +0.024% |
| 7 Days | -$36 | -0.003% |
| 30 Days | -$2,806 | -0.242% |
| 3 Months | -$5,102 | -0.439% |
| 6 Months | +$16.2k | +1.42% |
| 1 Year | -$61.4k | -5.04% |
| 3 Years | +$41.2k | +3.69% |
| 5 Years | +$185k | +19.1% |
| 10 Years | +$586k | +103% |
List My Property
Real Estate Statistics
Financing Solutions
AS SEEN ON


Are You a Licensed Real Estate Agent or Broker?