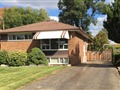
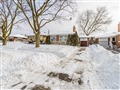
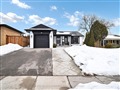
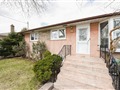
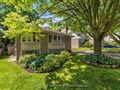
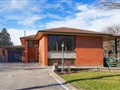
41 Fenley Dr
$1,563,317
Comparative Market Analysis
Jun 2, 2025
NOT AN ACTIVE LISTING
Historical Performance
| Period | $ Change | % Change |
| 1 Day | +$321 | +0.021% |
| 7 Days | -$188 | -0.012% |
| 30 Days | -$3,912 | -0.250% |
| 3 Months | -$6,327 | -0.403% |
| 6 Months | +$23.9k | +1.55% |
| 1 Year | -$79.6k | -4.85% |
| 3 Years | +$421k | +36.9% |
| 5 Years | +$584k | +59.7% |
| 10 Years | +$956k | +157% |
List My Property
Real Estate Statistics
Financing Solutions
Browsing History
55 Stewart St 434, Toronto
2 seconds ago
100 Western Battery Rd 1510, Toronto
3 seconds ago
80 Western Battery Rd 1107, Toronto
4 seconds ago
100 Western Battery Rd 305, Toronto
5 seconds ago
54 Manor Rd, Toronto
6 seconds ago
55 Stewart St 427, Toronto
13 seconds ago
669 Carlaw Ave, Toronto
14 seconds ago
399 Manor Rd, Toronto
15 seconds ago
55 Stewart St 524, Toronto
16 seconds ago
80 Western Battery Rd 2204, Toronto
17 seconds ago
AS SEEN ON


Are You a Licensed Real Estate Agent or Broker?