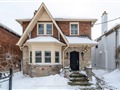
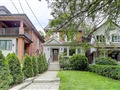
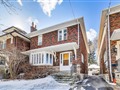
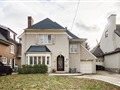
40 Burnaby Blvd
$2,402,663
Comparative Market Analysis
Jul 6, 2025
NOT AN ACTIVE LISTING
Historical Performance
| Period | $ Change | % Change |
| 1 Day | +$436 | +0.018% |
| 7 Days | -$285 | -0.012% |
| 30 Days | -$5,427 | -0.225% |
| 3 Months | -$6,875 | -0.285% |
| 6 Months | +$43.4k | +1.84% |
| 1 Year | -$108k | -4.31% |
| 3 Years | +$381k | +18.9% |
| 5 Years | +$615k | +34.4% |
| 10 Years | +$1.39m | +138% |
List My Property
Real Estate Statistics
Financing Solutions
Browsing History
3 Guernsey Dr, Toronto
2 seconds ago
25 Hancock Cres, Toronto
3 seconds ago
130 Angus Dr, Toronto
4 seconds ago
6 Wrenson Rd, Toronto
5 seconds ago
15 Greenview Ave 3009, Toronto
6 seconds ago
473 St. Johns Rd, Toronto
7 seconds ago
58 Winchester St, Toronto
8 seconds ago
3 Garden Circ, Toronto
8 seconds ago
AS SEEN ON


Are You a Licensed Real Estate Agent or Broker?