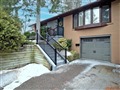
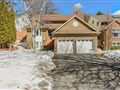
39 Milldock Dr
$1,467,335
Comparative Market Analysis
May 21, 2025
NOT AN ACTIVE LISTING
Historical Performance
| Period | $ Change | % Change |
| 1 Day | +$343 | +0.023% |
| 7 Days | -$5 | 0.000% |
| 30 Days | -$3,234 | -0.220% |
| 3 Months | -$5,222 | -0.355% |
| 6 Months | +$23.2k | +1.61% |
| 1 Year | -$72.1k | -4.68% |
| 3 Years | +$208k | +16.6% |
| 5 Years | +$361k | +32.7% |
| 10 Years | +$787k | +116% |
List My Property
Real Estate Statistics
Financing Solutions
Browsing History
5740 Yonge St 2206, Toronto
1 second ago
AS SEEN ON


Are You a Licensed Real Estate Agent or Broker?