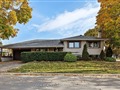
33 Tynevale Dr
$1,297,967
Comparative Market Analysis
Jun 27, 2025
NOT AN ACTIVE LISTING
Historical Performance
| Period | $ Change | % Change |
| 1 Day | +$288 | +0.022% |
| 7 Days | -$120 | -0.009% |
| 30 Days | -$3,270 | -0.251% |
| 3 Months | -$5,667 | -0.435% |
| 6 Months | +$18.7k | +1.46% |
| 1 Year | -$68.2k | -4.99% |
| 3 Years | +$178k | +15.9% |
| 5 Years | +$365k | +39.1% |
| 10 Years | +$669k | +106% |
List My Property
Real Estate Statistics
Financing Solutions
AS SEEN ON


Are You a Licensed Real Estate Agent or Broker?