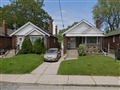
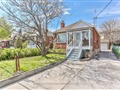
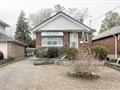
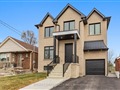
33 Derwyn Ave
$1,027,707
Comparative Market Analysis
Jun 20, 2025
NOT AN ACTIVE LISTING
Historical Performance
| Period | $ Change | % Change |
| 1 Day | +$223 | +0.022% |
| 7 Days | -$119 | -0.012% |
| 30 Days | -$2,664 | -0.259% |
| 3 Months | -$4,651 | -0.451% |
| 6 Months | +$14.5k | +1.43% |
| 1 Year | -$54.8k | -5.06% |
| 3 Years | +$103k | +11.1% |
| 5 Years | +$223k | +27.8% |
| 10 Years | +$547k | +114% |
List My Property
Real Estate Statistics
Financing Solutions
AS SEEN ON


Are You a Licensed Real Estate Agent or Broker?