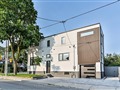
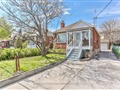
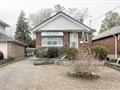
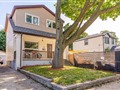
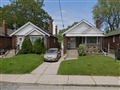
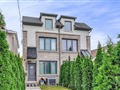
32 Norlong Blvd
$1,136,123
Comparative Market Analysis
Jun 20, 2025
NOT AN ACTIVE LISTING
Historical Performance
| Period | $ Change | % Change |
| 1 Day | +$247 | +0.022% |
| 7 Days | -$25 | -0.002% |
| 30 Days | -$2,421 | -0.213% |
| 3 Months | -$3,458 | -0.303% |
| 6 Months | +$19.5k | +1.74% |
| 1 Year | -$52.8k | -4.44% |
| 3 Years | +$139k | +13.9% |
| 5 Years | +$290k | +34.3% |
| 10 Years | +$670k | +144% |
List My Property
Real Estate Statistics
Financing Solutions
AS SEEN ON


Are You a Licensed Real Estate Agent or Broker?