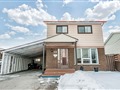
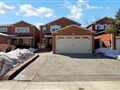
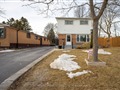
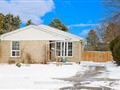
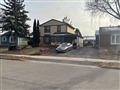
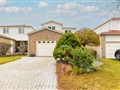
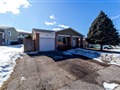
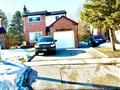
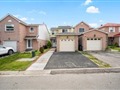
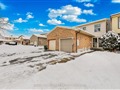
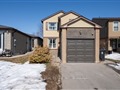
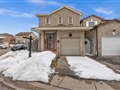
32 Greypoint Dr
$1,080,000
Comparative Market Analysis
Jul 1, 2025
NOT AN ACTIVE LISTING
Historical Performance
| Period | $ Change | % Change |
| 1 Day | +$279 | +0.026% |
| 7 Days | +$184 | +0.017% |
| 30 Days | -$1,719 | -0.159% |
| 3 Months | -$2,147 | -0.198% |
| 6 Months | +$20.2k | +1.90% |
| 1 Year | -$45.3k | -4.03% |
| 3 Years | +$192k | +21.6% |
| 5 Years | +$356k | +49.3% |
| 10 Years | +$701k | +185% |
List My Property
Real Estate Statistics
Financing Solutions
Browsing History
11 Rockwell Ave, Toronto
5 seconds ago
41 Brickworks Lane, Toronto
10 seconds ago
577 Woodbine Ave, Toronto
15 seconds ago
308 Palmerston Blvd, Toronto
20 seconds ago
65 Binscarth Rd, Toronto
24 seconds ago
8 Horfield Ave, Toronto
28 seconds ago
AS SEEN ON


Are You a Licensed Real Estate Agent or Broker?