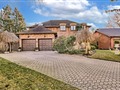
31 Bridgeport Dr
$1,384,402
Comparative Market Analysis
Jun 11, 2025
NOT AN ACTIVE LISTING
Historical Performance
| Period | $ Change | % Change |
| 1 Day | +$317 | +0.023% |
| 7 Days | -$36 | -0.003% |
| 30 Days | -$3,136 | -0.226% |
| 3 Months | -$5,077 | -0.365% |
| 6 Months | +$21.7k | +1.59% |
| 1 Year | -$68.4k | -4.71% |
| 3 Years | +$242k | +21.2% |
| 5 Years | +$425k | +44.3% |
| 10 Years | +$811k | +142% |
List My Property
Real Estate Statistics
Financing Solutions
Browsing History
32 Haviland Dr, Toronto
1 second ago
32 Neames Cres, Toronto
1 second ago
109 Long Island Cres, Toronto
1 second ago
165 Regent Rd, Toronto
2 seconds ago
52 Herbert Ave, Toronto
2 seconds ago
53 West Oak Cres, Toronto
2 seconds ago
306 Pellatt Ave, Toronto
2 seconds ago
AS SEEN ON


Are You a Licensed Real Estate Agent or Broker?