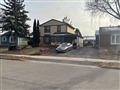
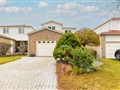
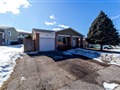
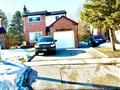
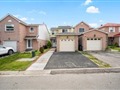
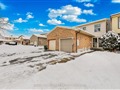
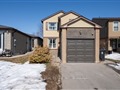
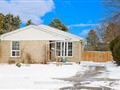
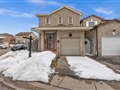
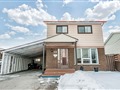
23 Griffen Dr
$1,144,404
Comparative Market Analysis
Jun 6, 2025
NOT AN ACTIVE LISTING
Historical Performance
| Period | $ Change | % Change |
| 1 Day | +$296 | +0.026% |
| 7 Days | +$154 | +0.013% |
| 30 Days | -$2,026 | -0.177% |
| 3 Months | -$2,941 | -0.256% |
| 6 Months | +$20.0k | +1.78% |
| 1 Year | -$51.2k | -4.28% |
| 3 Years | +$192k | +20.2% |
| 5 Years | +$359k | +45.6% |
| 10 Years | +$718k | +168% |
List My Property
Real Estate Statistics
Financing Solutions
Browsing History
120 St Patrick St 810, Toronto
2 seconds ago
116 Littles Rd, Toronto
3 seconds ago
165 Tapscott Rd 08, Toronto
4 seconds ago
53 Bloem Ave, Toronto
5 seconds ago
40 Rexdale Blvd 31, Toronto
6 seconds ago
40 Rexdale Blvd 38, Toronto
7 seconds ago
152 St Patrick St 910, Toronto
8 seconds ago
20 Manitoba St, Toronto
9 seconds ago
152 St Patrick St PH10, Toronto
10 seconds ago
16 Burke St, Toronto
11 seconds ago
AS SEEN ON


Are You a Licensed Real Estate Agent or Broker?