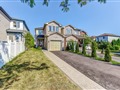
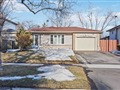
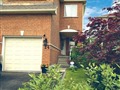
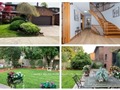
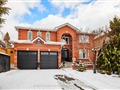
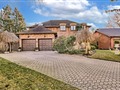
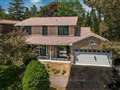
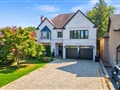
23 Bridgeport Dr
$1,424,403
Comparative Market Analysis
Jun 10, 2025
NOT AN ACTIVE LISTING
Historical Performance
| Period | $ Change | % Change |
| 1 Day | +$326 | +0.023% |
| 7 Days | -$50 | -0.004% |
| 30 Days | -$3,288 | -0.230% |
| 3 Months | -$5,422 | -0.379% |
| 6 Months | +$21.9k | +1.56% |
| 1 Year | -$71.4k | -4.77% |
| 3 Years | +$246k | +20.9% |
| 5 Years | +$432k | +43.6% |
| 10 Years | +$827k | +139% |
List My Property
Real Estate Statistics
Financing Solutions
Browsing History
18 Viamede Cres, Toronto
1 second ago
12 Freeport Dr, Toronto
2 seconds ago
54 Cedarvale Ave, Toronto
3 seconds ago
16 Hearne Ave, Toronto
4 seconds ago
45 Sixteenth St, Toronto
5 seconds ago
Aymarn Crt, Toronto
6 seconds ago
73 Pepper Tree Dr, Toronto
7 seconds ago
182 Benjamin Boake Tr, Toronto
8 seconds ago
76 Sixteenth St, Toronto
9 seconds ago
143 Glen Albert Dr, Toronto
10 seconds ago
AS SEEN ON


Are You a Licensed Real Estate Agent or Broker?