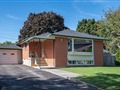
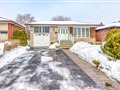
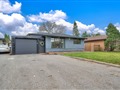
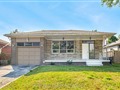
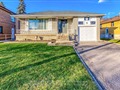
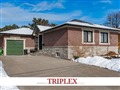
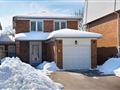
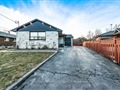
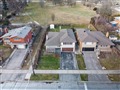
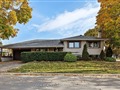
21 Tynevale Dr
$1,210,925
Comparative Market Analysis
Jun 24, 2025
NOT AN ACTIVE LISTING
Historical Performance
| Period | $ Change | % Change |
| 1 Day | +$269 | +0.022% |
| 7 Days | -$32 | -0.003% |
| 30 Days | -$2,660 | -0.219% |
| 3 Months | -$4,012 | -0.330% |
| 6 Months | +$20.1k | +1.69% |
| 1 Year | -$57.4k | -4.52% |
| 3 Years | +$187k | +18.3% |
| 5 Years | +$376k | +45.1% |
| 10 Years | +$667k | +123% |
List My Property
Real Estate Statistics
Financing Solutions
Browsing History
236 Albion Rd 102, Toronto
1 second ago
50 Mccartney St 1002, Toronto
2 seconds ago
11 Fleetwell Crt, Toronto
2 seconds ago
AS SEEN ON


Are You a Licensed Real Estate Agent or Broker?