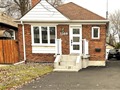
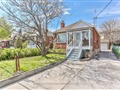
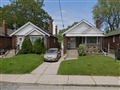
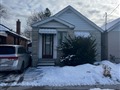
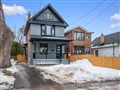
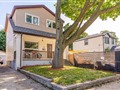
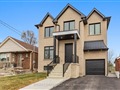
21 Treadway Blvd
$1,481,206
Comparative Market Analysis
Jul 11, 2025
NOT AN ACTIVE LISTING
Historical Performance
| Period | $ Change | % Change |
| 1 Day | +$322 | +0.022% |
| 7 Days | +$40 | +0.003% |
| 30 Days | -$2,803 | -0.189% |
| 3 Months | -$3,356 | -0.226% |
| 6 Months | +$27.8k | +1.91% |
| 1 Year | -$63.2k | -4.09% |
| 3 Years | +$201k | +15.7% |
| 5 Years | +$415k | +38.9% |
| 10 Years | +$917k | +163% |
List My Property
Real Estate Statistics
Financing Solutions
AS SEEN ON


Are You a Licensed Real Estate Agent or Broker?