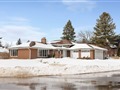
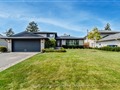
21 Thornbury Cres
$3,041,235
Comparative Market Analysis
Jun 23, 2025
NOT AN ACTIVE LISTING
Historical Performance
| Period | $ Change | % Change |
| 1 Day | +$599 | +0.020% |
| 7 Days | -$557 | -0.018% |
| 30 Days | -$8,286 | -0.272% |
| 3 Months | -$16.1k | -0.527% |
| 6 Months | +$37.9k | +1.26% |
| 1 Year | -$176k | -5.47% |
| 3 Years | +$246k | +8.81% |
| 5 Years | +$485k | +19.0% |
| 10 Years | +$1.38m | +83.6% |
List My Property
Real Estate Statistics
Financing Solutions
Browsing History
Fallingdale Cres, Toronto
6 seconds ago
The Palisades, Toronto
11 seconds ago
AS SEEN ON


Are You a Licensed Real Estate Agent or Broker?