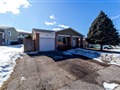
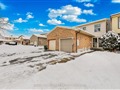
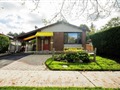
21 Parsonage Dr
$1,089,807
Comparative Market Analysis
May 20, 2025
NOT AN ACTIVE LISTING
Historical Performance
| Period | $ Change | % Change |
| 1 Day | +$282 | +0.026% |
| 7 Days | +$25 | +0.002% |
| 30 Days | -$2,521 | -0.231% |
| 3 Months | -$4,700 | -0.429% |
| 6 Months | +$15.2k | +1.41% |
| 1 Year | -$57.5k | -5.01% |
| 3 Years | +$157k | +16.8% |
| 5 Years | +$297k | +37.4% |
| 10 Years | +$616k | +130% |
List My Property
Real Estate Statistics
Financing Solutions
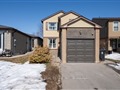
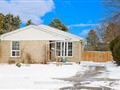
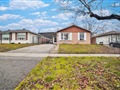
Browsing History
140 Leeward Glenway 220, Toronto
1 second ago
15 Greenview Ave 2504, Toronto
1 second ago
107 Wharnsby Dr, Toronto
1 second ago
380 Dixon Rd 1908, Toronto
2 seconds ago
AS SEEN ON


Are You a Licensed Real Estate Agent or Broker?