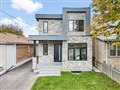
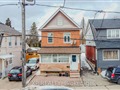
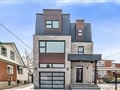
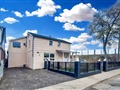
21 Mahoney Ave
$949,630
Comparative Market Analysis
Jul 4, 2025
NOT AN ACTIVE LISTING
Historical Performance
| Period | $ Change | % Change |
| 1 Day | +$254 | +0.027% |
| 7 Days | +$120 | +0.013% |
| 30 Days | -$1,800 | -0.189% |
| 3 Months | -$2,931 | -0.308% |
| 6 Months | +$15.6k | +1.67% |
| 1 Year | -$44.3k | -4.45% |
| 3 Years | +$114k | +13.6% |
| 5 Years | +$250k | +35.7% |
| 10 Years | +$515k | +118% |
List My Property
Real Estate Statistics
Financing Solutions
Browsing History
35 Portrush Cres, Toronto
1 second ago
267 Leslie St, Toronto
1 second ago
1108 Warden Ave, Toronto
2 seconds ago
8 Oliti Crt, Toronto
2 seconds ago
14 Greenbriar Rd, Toronto
2 seconds ago
27 Treadgold Cres, Toronto
2 seconds ago
235 Leslie St, Toronto
3 seconds ago
AS SEEN ON

Are You a Licensed Real Estate Agent or Broker?