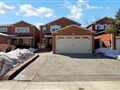
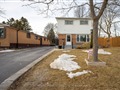
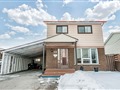
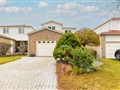
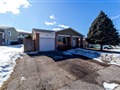
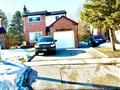
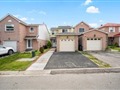
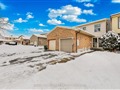
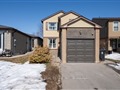
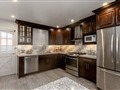
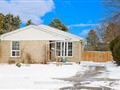
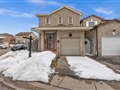
20 Griffen Dr
$1,283,647
Comparative Market Analysis
Jun 6, 2025
NOT AN ACTIVE LISTING
Historical Performance
| Period | $ Change | % Change |
| 1 Day | +$332 | +0.026% |
| 7 Days | +$244 | +0.019% |
| 30 Days | -$1,914 | -0.149% |
| 3 Months | -$2,079 | -0.162% |
| 6 Months | +$25.1k | +2.00% |
| 1 Year | -$50.6k | -3.79% |
| 3 Years | +$244k | +23.4% |
| 5 Years | +$450k | +53.9% |
| 10 Years | +$818k | +175% |
List My Property
Real Estate Statistics
Financing Solutions
Browsing History
38 Waxham Rd, Toronto
1 second ago
10 Esterbrooke Ave 40, Toronto
3 seconds ago
541 Blackthorn Ave 307, Toronto
4 seconds ago
61 Waterloo Ave, Toronto
5 seconds ago
Forest Manor Rd, Toronto
5 seconds ago
18 Glen Hollow Ave, Toronto
7 seconds ago
46 Janda Crt, Toronto
8 seconds ago
7 Lorraine Dr 1803, Toronto
9 seconds ago
29 Rangeley Dr, Toronto
10 seconds ago
11 Moon Valley Dr, Toronto
11 seconds ago
AS SEEN ON


Are You a Licensed Real Estate Agent or Broker?