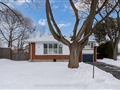
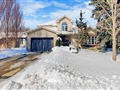
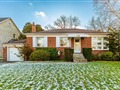
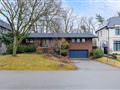
19 Cheshire Dr
$1,532,412
Comparative Market Analysis
Jun 29, 2025
NOT AN ACTIVE LISTING
Historical Performance
| Period | $ Change | % Change |
| 1 Day | +$302 | +0.020% |
| 7 Days | -$281 | -0.018% |
| 30 Days | -$4,175 | -0.272% |
| 3 Months | -$7,076 | -0.460% |
| 6 Months | +$21.8k | +1.44% |
| 1 Year | -$81.9k | -5.07% |
| 3 Years | +$155k | +11.3% |
| 5 Years | +$311k | +25.4% |
| 10 Years | +$802k | +110% |
List My Property
Real Estate Statistics
Financing Solutions
Browsing History
25 Glenellen Dr, Toronto
5 seconds ago
152 Roxborough Dr, Toronto
10 seconds ago
101 Briarwood Ave, Toronto
15 seconds ago
10 Blue Forest Dr, Toronto
17 seconds ago
AS SEEN ON


Are You a Licensed Real Estate Agent or Broker?