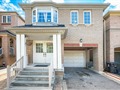
18 Fox Pt
$2,308,758
Comparative Market Analysis
Jun 6, 2025
NOT AN ACTIVE LISTING
Historical Performance
| Period | $ Change | % Change |
| 1 Day | +$551 | +0.024% |
| 7 Days | -$103 | -0.004% |
| 30 Days | -$5,659 | -0.245% |
| 3 Months | -$10.2k | -0.441% |
| 6 Months | +$32.3k | +1.42% |
| 1 Year | -$123k | -5.04% |
| 3 Years | +$428k | +22.8% |
| 5 Years | +$1.03m | +80.3% |
| 10 Years | +$1.87m | +422% |
List My Property
Real Estate Statistics
Financing Solutions
Browsing History
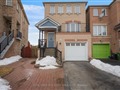
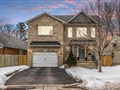
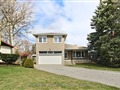
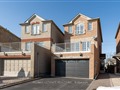
128 Edinborough Crt, Toronto
1 second ago
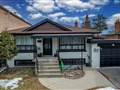
22 Muir Dr, Toronto
2 seconds ago
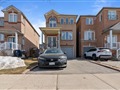
38 Harlton Cres, Toronto
3 seconds ago
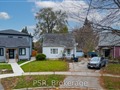
94 Morse St, Toronto
4 seconds ago
323 Silverthorn Ave, Toronto
5 seconds ago
5 Shudell Ave, Toronto
6 seconds ago
10 Lindsey Ave, Toronto
7 seconds ago
22 Harlton Cres, Toronto
8 seconds ago
45 Ambercroft Blvd, Toronto
9 seconds ago
19 Fundy Bay Blvd, Toronto
10 seconds ago
AS SEEN ON


Are You a Licensed Real Estate Agent or Broker?