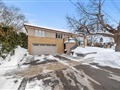
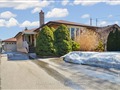
16 Brunner Dr
$1,464,511
Comparative Market Analysis
Jun 29, 2025
NOT AN ACTIVE LISTING
Historical Performance
| Period | $ Change | % Change |
| 1 Day | +$330 | +0.023% |
| 7 Days | -$82 | -0.006% |
| 30 Days | -$3,476 | -0.237% |
| 3 Months | -$5,776 | -0.393% |
| 6 Months | +$22.3k | +1.54% |
| 1 Year | -$74.0k | -4.81% |
| 3 Years | +$269k | +22.5% |
| 5 Years | +$427k | +41.2% |
| 10 Years | +$816k | +126% |
List My Property
Real Estate Statistics
Financing Solutions
AS SEEN ON


Are You a Licensed Real Estate Agent or Broker?