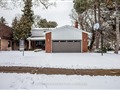
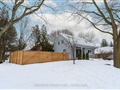
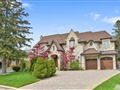
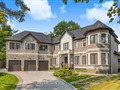
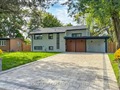
16 Apollo Dr
$3,628,132
Comparative Market Analysis
Jul 7, 2025
NOT AN ACTIVE LISTING
Historical Performance
| Period | $ Change | % Change |
| 1 Day | +$643 | +0.018% |
| 7 Days | -$417 | -0.011% |
| 30 Days | -$7,973 | -0.219% |
| 3 Months | -$9,335 | -0.257% |
| 6 Months | +$68.2k | +1.91% |
| 1 Year | -$157k | -4.14% |
| 3 Years | +$585k | +19.2% |
| 5 Years | +$870k | +31.6% |
| 10 Years | +$2.06m | +131% |
List My Property
Real Estate Statistics
Financing Solutions
Browsing History
19 Strathallan Blvd, Toronto
1 second ago
5 Hemlock Ave, Toronto
1 second ago
3 Carnegie Crt, Toronto
1 second ago
25 Baffin Crt, Toronto
1 second ago
12 Parsborough Crt, Toronto
2 seconds ago
AS SEEN ON


Are You a Licensed Real Estate Agent or Broker?