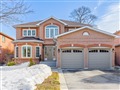
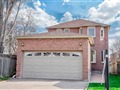
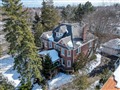
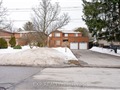
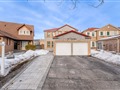
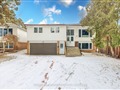
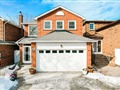
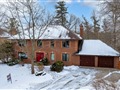
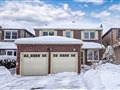
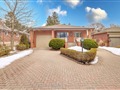
139 Calverley Tr
$1,346,134
Comparative Market Analysis
May 31, 2025
NOT AN ACTIVE LISTING
Historical Performance
| Period | $ Change | % Change |
| 1 Day | +$310 | +0.023% |
| 7 Days | -$67 | -0.005% |
| 30 Days | -$3,223 | -0.239% |
| 3 Months | -$5,531 | -0.409% |
| 6 Months | +$19.9k | +1.50% |
| 1 Year | -$69.3k | -4.90% |
| 3 Years | +$226k | +20.2% |
| 5 Years | +$372k | +38.3% |
| 10 Years | +$744k | +124% |
List My Property
Real Estate Statistics
Financing Solutions
Browsing History
18 Satok Terr, Toronto
1 second ago
64 Satok Terr, Toronto
1 second ago
AS SEEN ON


Are You a Licensed Real Estate Agent or Broker?