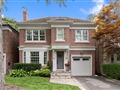
13 Burnham Rd
$3,294,552
Comparative Market Analysis
Jun 26, 2025
NOT AN ACTIVE LISTING
Historical Performance
| Period | $ Change | % Change |
| 1 Day | +$579 | +0.018% |
| 7 Days | -$811 | -0.025% |
| 30 Days | -$9,318 | -0.282% |
| 3 Months | -$15.2k | -0.458% |
| 6 Months | +$48.1k | +1.48% |
| 1 Year | -$175k | -5.05% |
| 3 Years | +$341k | +11.6% |
| 5 Years | +$629k | +23.6% |
| 10 Years | +$1.62m | +97.0% |
List My Property
Real Estate Statistics
Financing Solutions
Browsing History
47 Castle Frank Cres, Toronto
1 second ago
AS SEEN ON


Are You a Licensed Real Estate Agent or Broker?