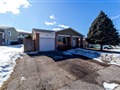
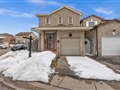
115 Crow Tr
$1,176,088
Comparative Market Analysis
Jun 26, 2025
NOT AN ACTIVE LISTING
Historical Performance
| Period | $ Change | % Change |
| 1 Day | +$304 | +0.026% |
| 7 Days | +$25 | +0.002% |
| 30 Days | -$2,730 | -0.232% |
| 3 Months | -$5,101 | -0.432% |
| 6 Months | +$16.3k | +1.41% |
| 1 Year | -$62.2k | -5.02% |
| 3 Years | +$181k | +18.2% |
| 5 Years | +$356k | +43.4% |
| 10 Years | +$737k | +168% |
List My Property
Real Estate Statistics
Financing Solutions
Browsing History
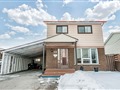
119 Crow Tr, Toronto
1 second ago
138 Crow Tr, Toronto
1 second ago
AS SEEN ON


Are You a Licensed Real Estate Agent or Broker?